Exploring the toolkit of the MPS planner: the Rough Cut Capacity Plan
In this blog, we will give an introduction to one of the tools you will need to make a good master production schedule: the Rough Cut Capacity Plan.
Before we start, let’s recap
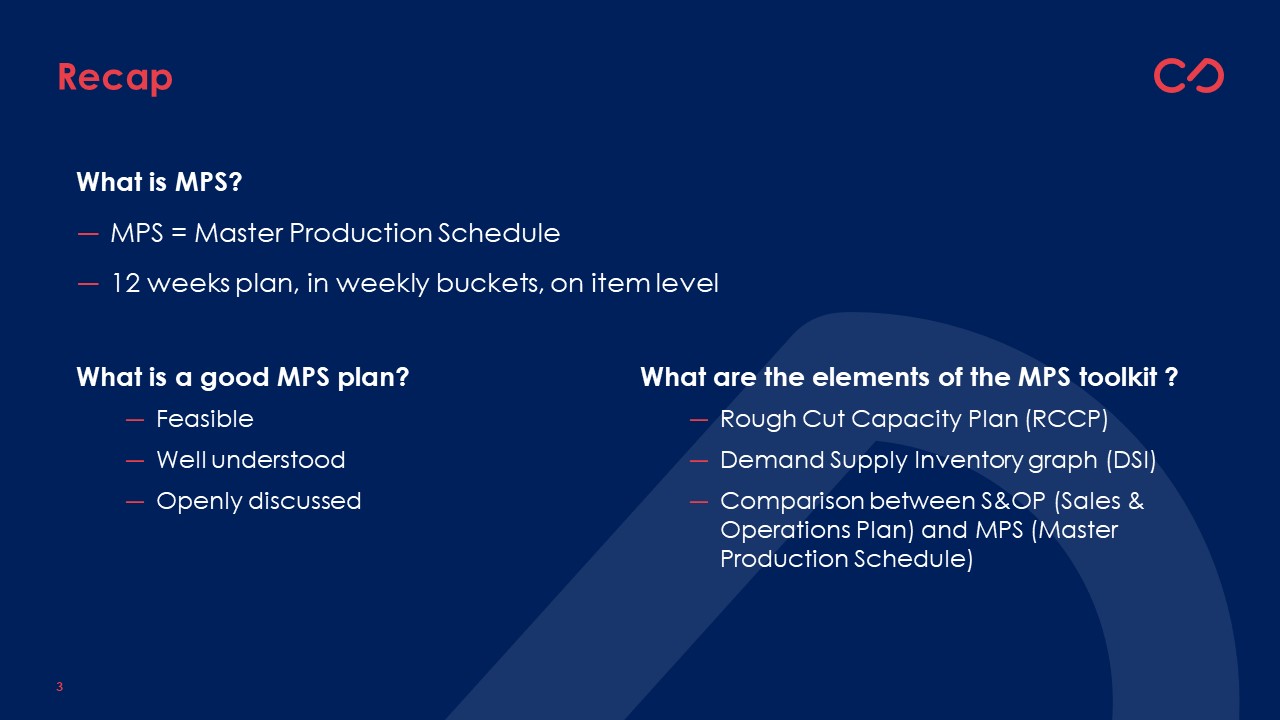
In one of the last blogs, we indicated the Master Production Schedule is the item-level plan in the upcoming MPS horizon, typically divided in weekly buckets and covering a 12-week horizon.
We also highlighted what we believe characterizes a ‘good master production schedule’. We mentioned it needs to be:
- Feasible
- Well-understood
- Openly discussed
If you want to know more about the above statements, don’t hesitate to refer to the previous blogs. You can find them all on our website www.allics.be.
Introduction to the toolkit
Today, we want to reveal how to come to a better understanding of the Master Production Schedule! We will introduce you to one of the elements of the MPS toolkit!
The MPS toolkit consists basically of three elements:
- The Rough Cut Capacity Plan
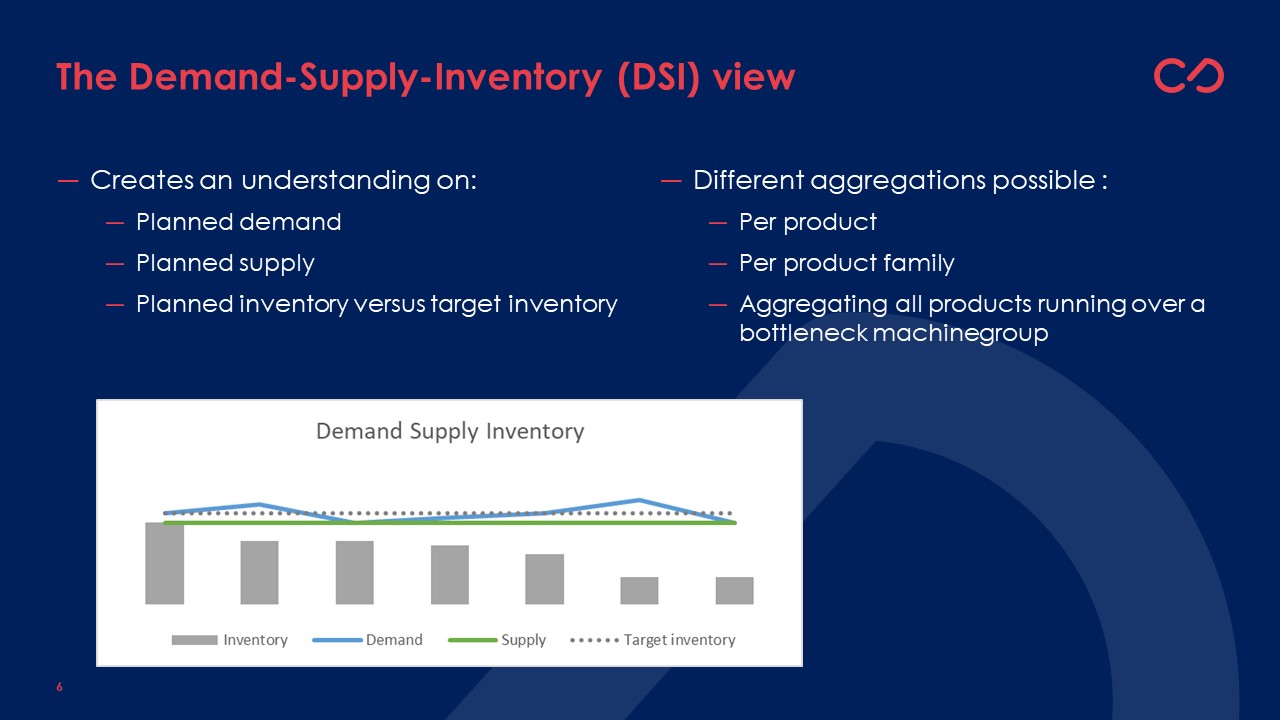
- The DSI graph (Demand-Supply-Inventory)
- The Comparison of the MPS versus the S&OP
Next to that, there are various KPI’s that you want to measure to support the understanding. We don’t want to completely overwhelm you with all this information in one single blog. So, we decided to focus this blog purely on the toolkit. We will keep the KPI’s, processes, meeting setups for one of our upcoming blogs.
The Rough Cut Capacity Plan
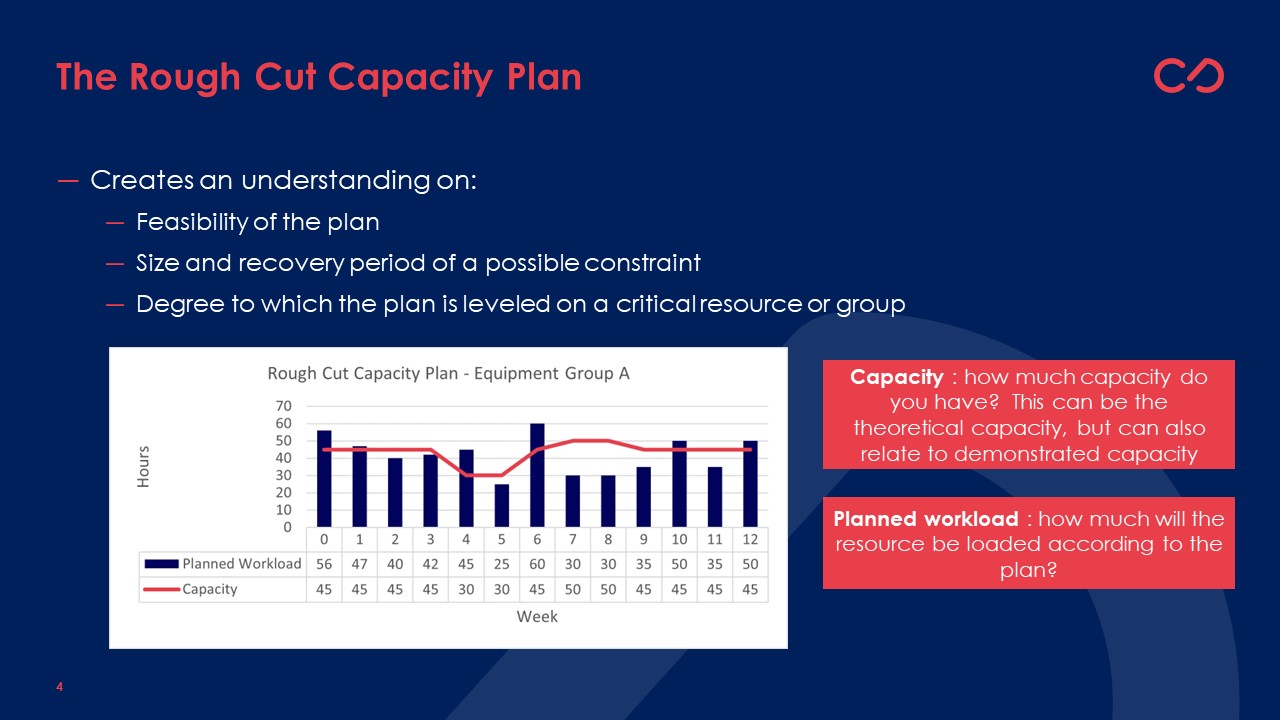
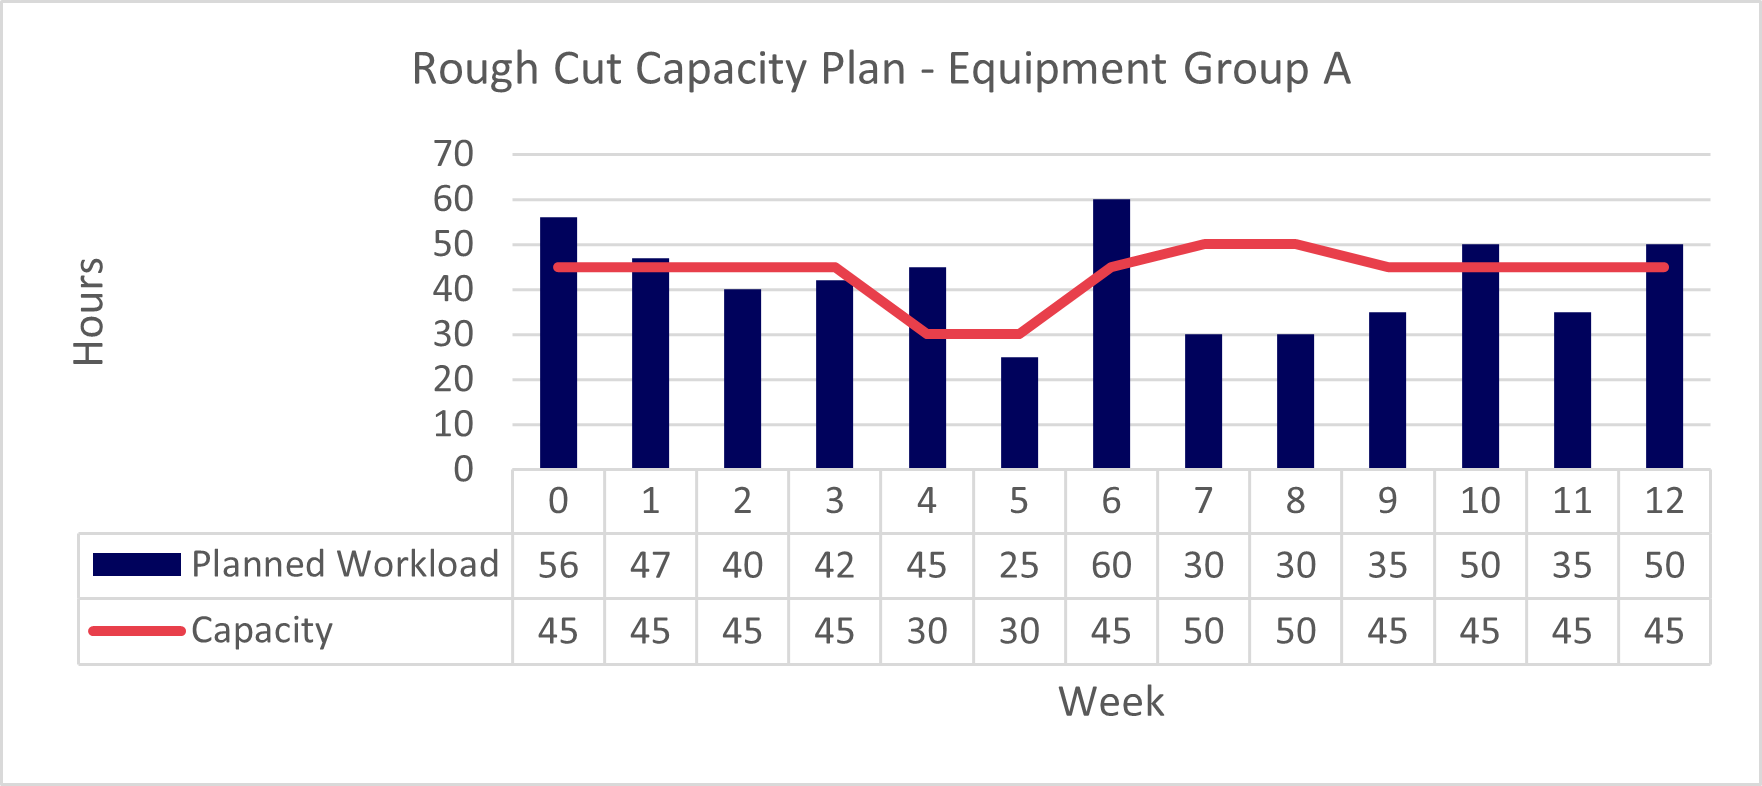
The Rough Cut Capacity Plan shows, per equipment group, the planned capacity load versus the available or demonstrated capacity. It creates an understanding on:
- The feasibility of the plan
- The size and recovery period of a possible constraint
- The degree to which the plan is leveled per critical resource. A well leveled plan enables rhythm and predictability in the plant. It prevents surprises and enables a good flow.
An equipment group
An equipment group can be a group of e.g., similar machines, performing similar operations and at a similar capacity and speed.
The planned capacity load
The planned capacity load is the load that the current master production schedule generates on that equipment group.
The available capacity
The available capacity is the overall capacity that this equipment group has available. One could calculate this ‘available capacity’ based on e.g., the shift system and ‘physical availability’ of the equipment group. However, in reality, very often these capacities can never fully be realized as they don’t fully account for possible inefficiencies and waiting times. Therefore, it is very useful to compare the planned load versus the demonstrated capacity.
How to express the available capacity and the load?
In theory, you want to create the RCCP per equipment expressed in time (e.g., number of hours). That is the most ‘correct’ comparison. However, you cannot divide your full MPS plan endlessly in number of hours, so, if you find it easier to talk about it in a different unit of measure (volume, number of batches), don’t let the theory hold you from doing something simpler that helps you create insight in the delta between the work you ‘plan’ versus the work you are able to handle.
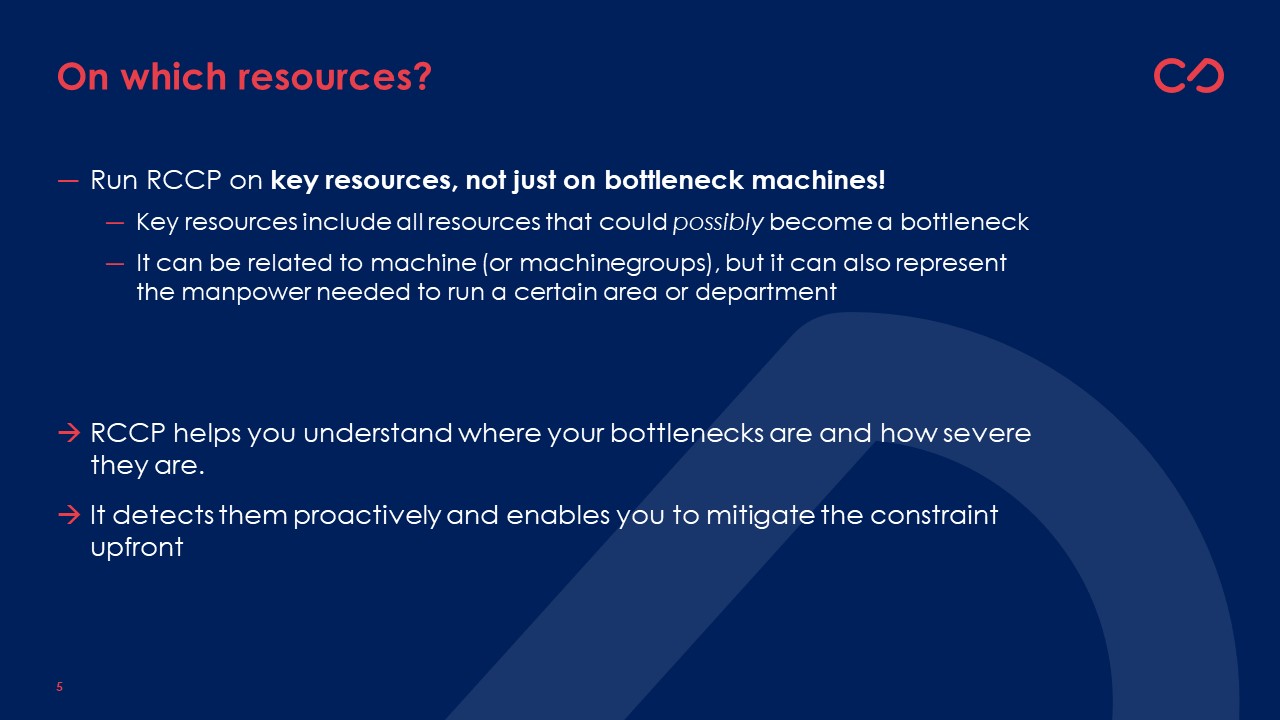
On which resources should you run the RCCP?
APICS says: “you need to run an RCCP for key resources, being labor, machinery, warehouse space, suppliers’ capability and possibly money.”
Some organizations translate these ‘key resources’ into running an ‘RCCP on the bottleneck machines’. According to us, that is a strange thinking path. The RCCP should help you understand where your bottlenecks are expected and how severe they are. It should help you detect them proactively mitigate the constraint upfront. Running only an RCCP on what people define as ‘bottleneck equipment’ is like asking Google to always propose the ‘shortest way’ assuming it will be the ’fastest’, and not include any information on the actual traffic. The RCCP should show you in a dynamic way, given the current planning and availabilities, whether or not a certain resource is to be considered a bottleneck.
So, in our opinion, you need to run an RCCP on all your key resources, being all resources that could possibly create a bottleneck, which will often be more than the ones people would define as a bottleneck at any given time. As long as the RCCP shows the equipment group is not constrained, you don’t necessarily need to spend much time reviewing it, but the tool will force you to detect upcoming bottlenecks in a structured way.
How do you know how severe the bottleneck is?
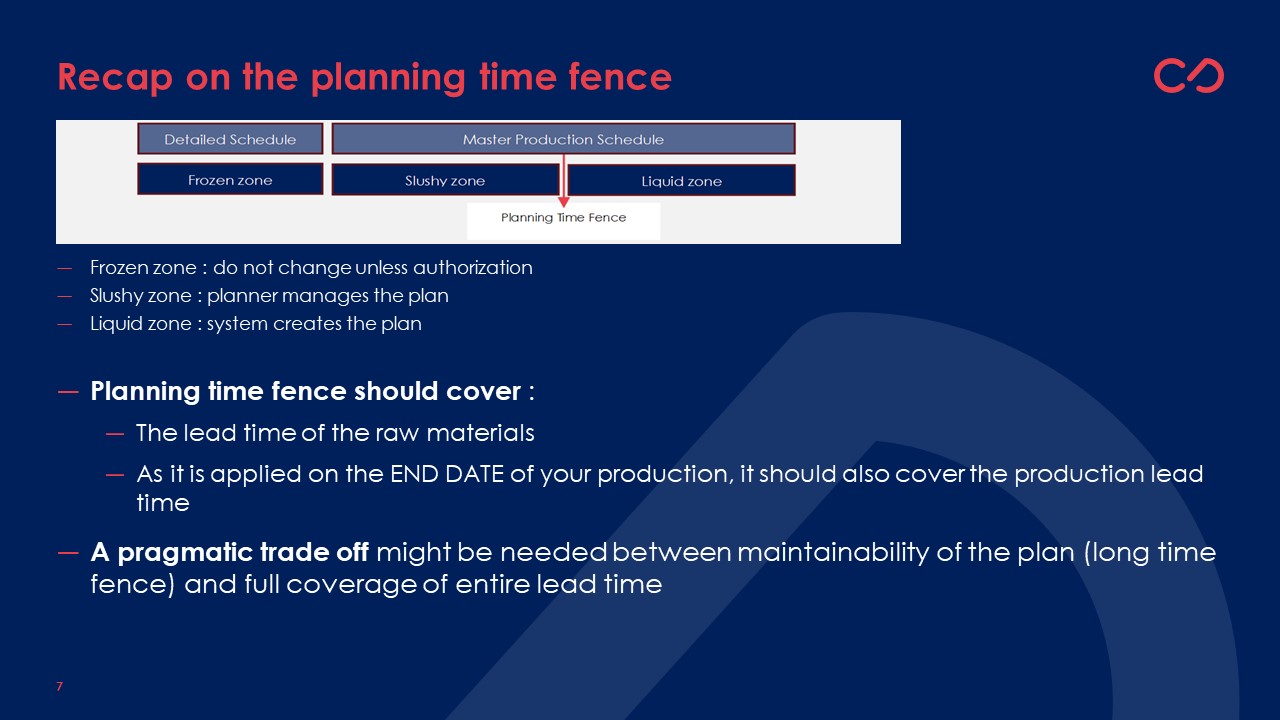
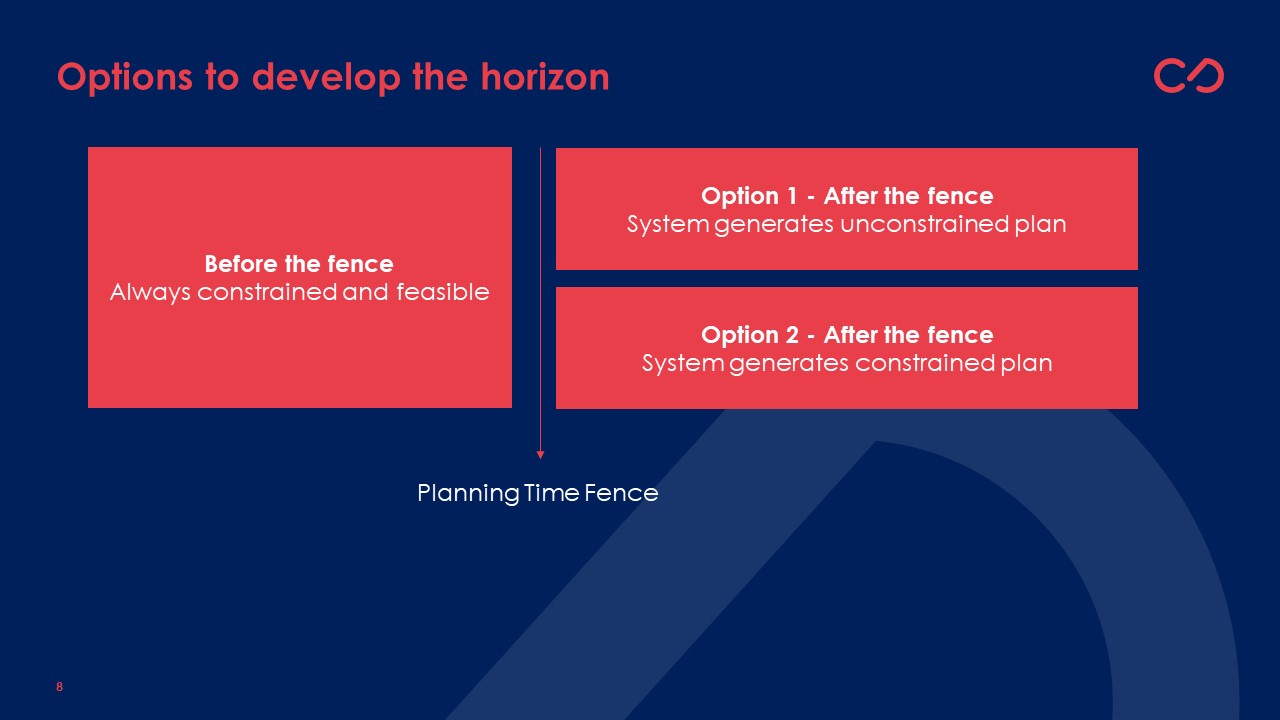
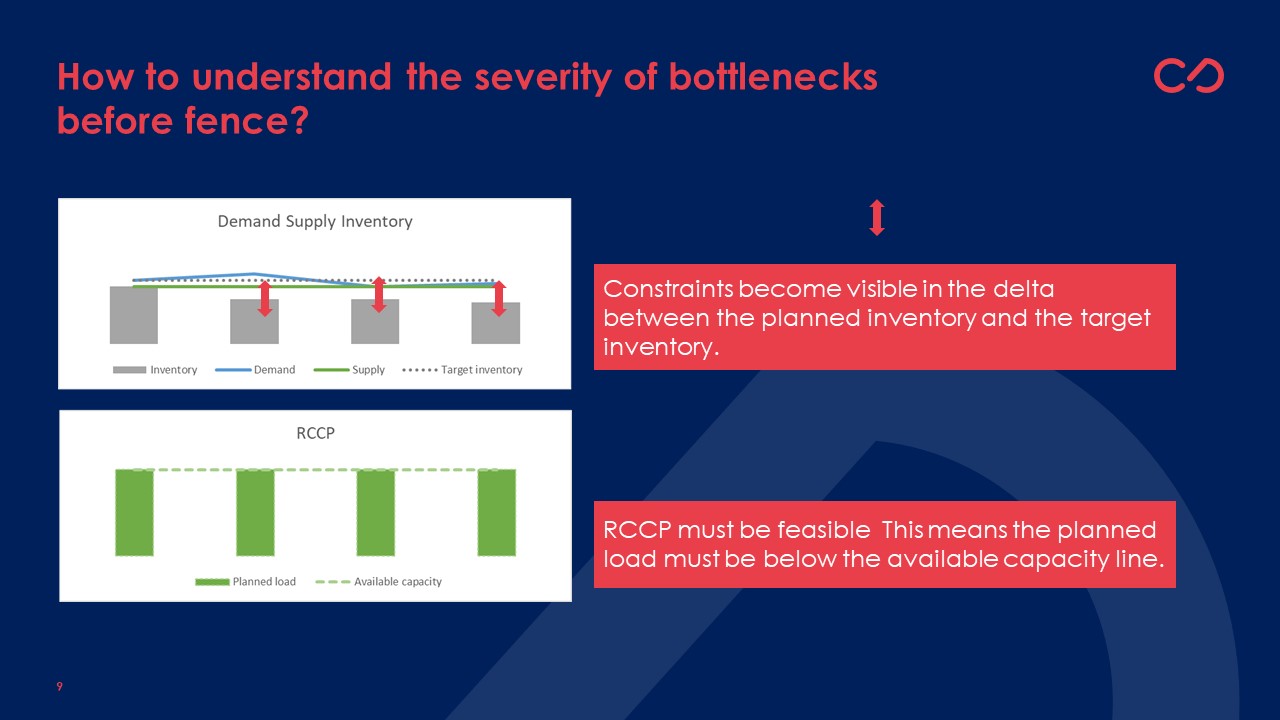
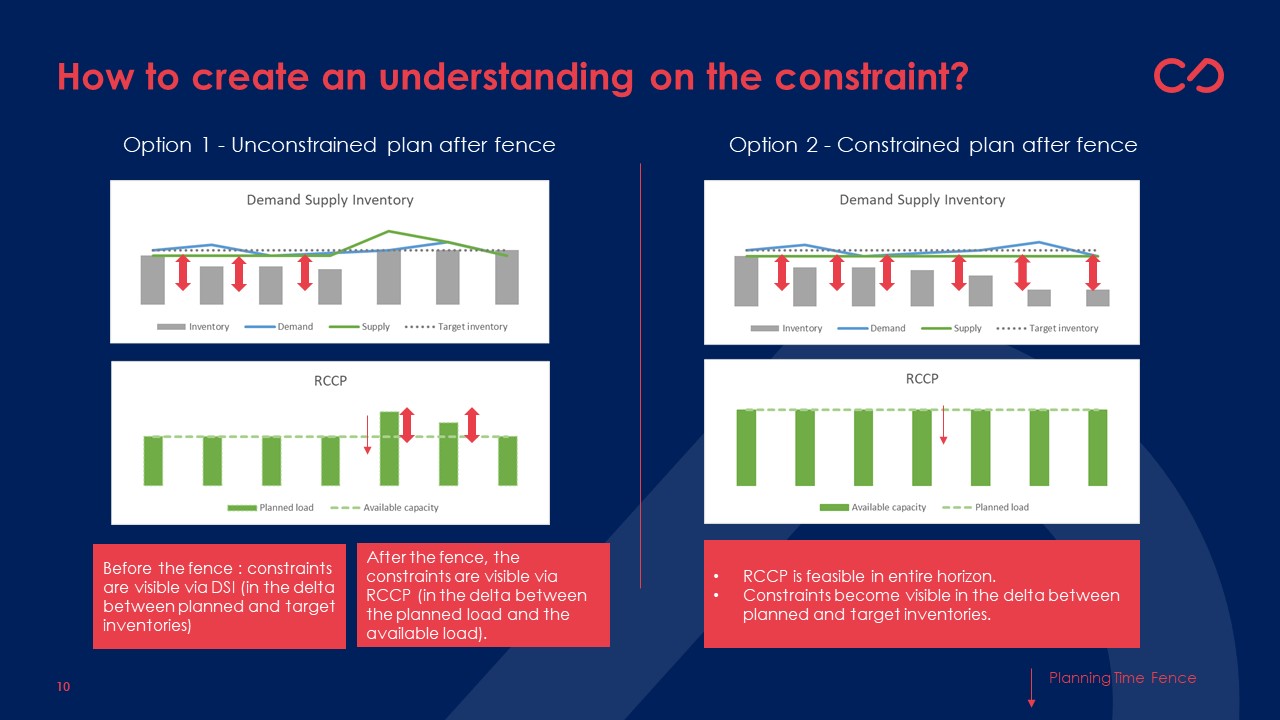
In the previous blog, we have indicated that a good MPS is feasible, at least before the planning time fence. After the planning time fence, the planning system might suggest an unconstrained plan (possibly showing an overload on your capacities) or might suggest a constrained plan (possibly showing a projected service level problem).
You need an RCCP to validate whether your MPS is indeed feasible. If there are currently planned capacity overloads, you need to adapt the MPS, at least before the fence.
If the planning tool creates an unconstrained plan after the fence, you will typically see an overload after the fence, often referred to as ‘the peak’, or ‘the bubble’. This ‘peak’ shows the unconstrained load on the equipment group.
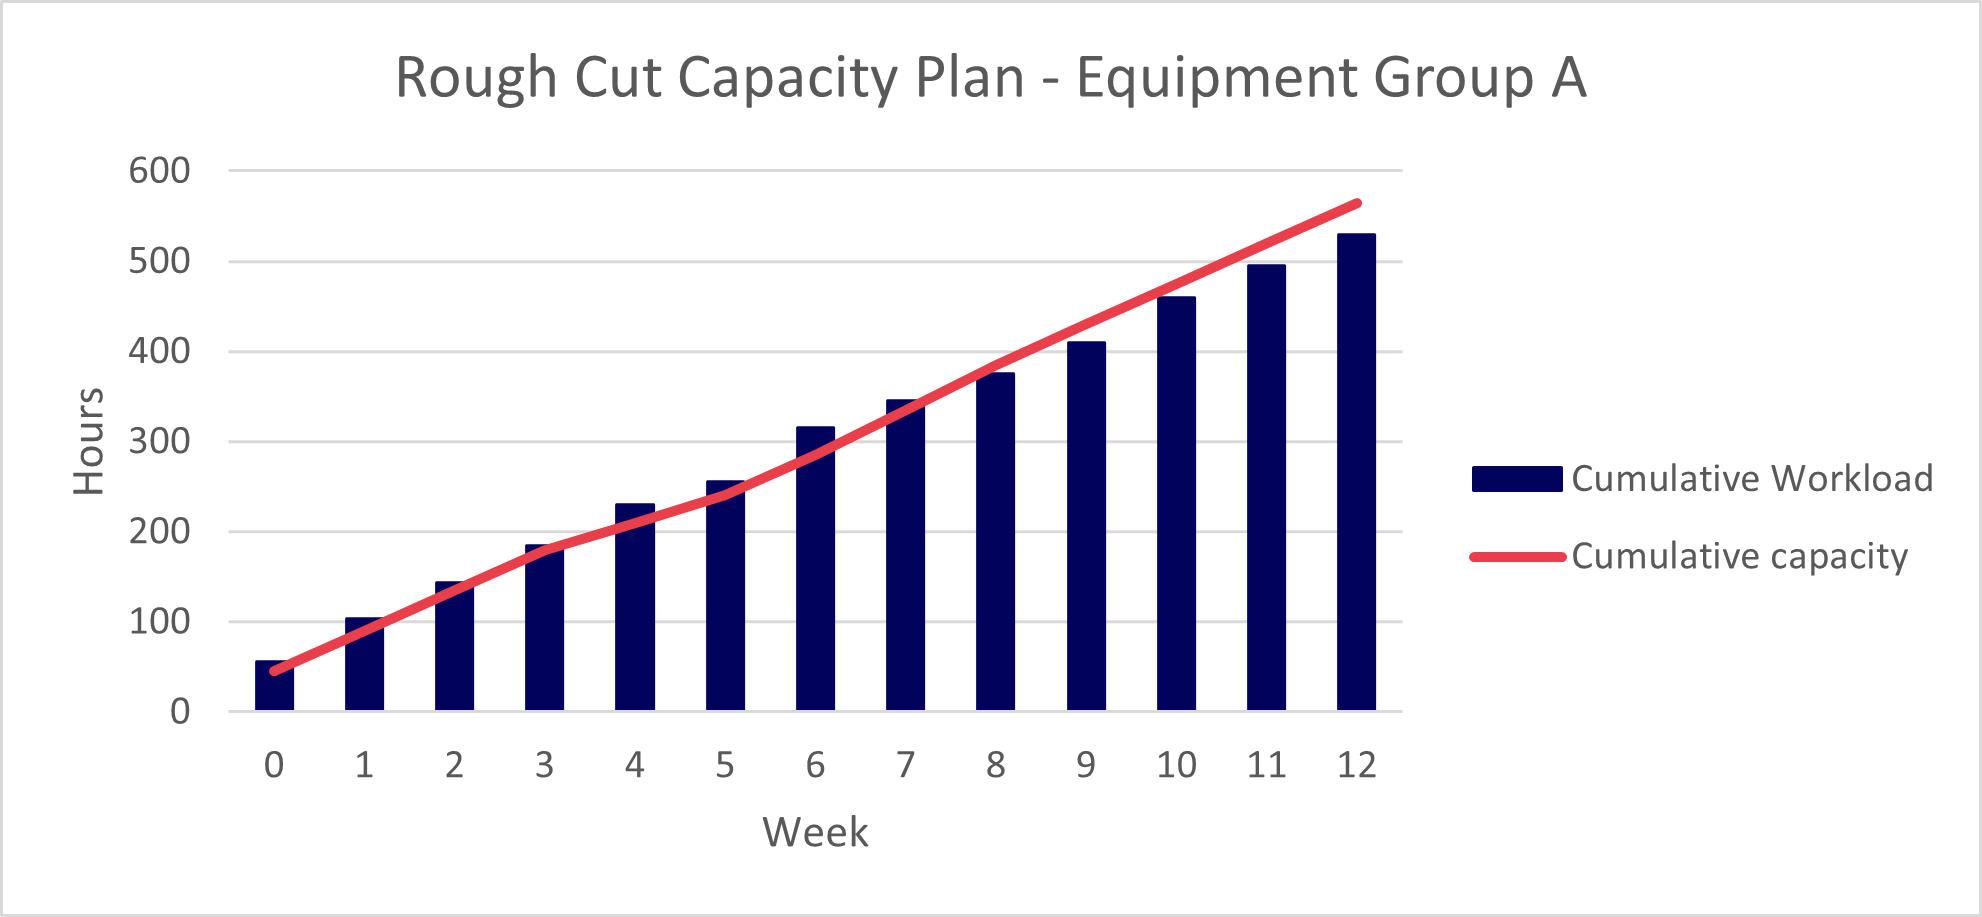
In such a case, it is useful to translate the bottleneck into a ‘recovery period’. This will indicate ‘by when’ we will again be able to support the unconstrained demand. In order to do this, we recommend showing the RCCP in a cumulative way, showing in each bucket:
- How much capacity you will have by that time.
- How much load you will have by that time.
- Assuming you can always plan towards max capacity (if this is not the case, you might want to consider calculating a forward cumulative line).
By doing that, the planner can conclude by when the bottleneck’s capa again matches the need. This will help to understand by when an expected service level issue can be solved.
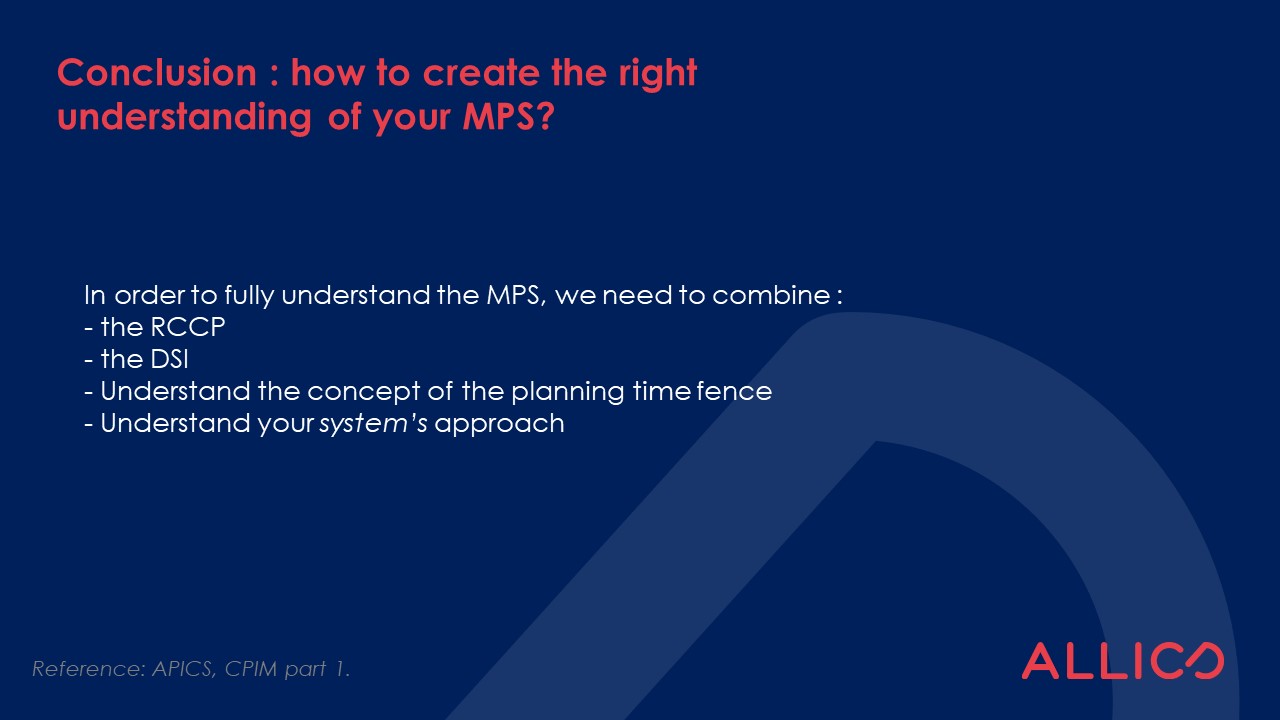
To conclude: To create the needed understanding, the RCCP is needed but not sufficient
The RCCP is a very helpful tool and has its key-position in the MPS toolkit. However, the RCCP alone will not give you full understanding.
As we mentioned, the RCCP might show no problems if the planning system immediately creates a constrained plan. Also, within the fence, the planner will aim to maintain a feasible plan. However, this plan might not meet all demand or might lead to overstocks. Therefore, it is important to combine the info from the RCCP with the information on the projected service levels and inventories.
References
APICS, CPIM Part 1

